The best case and the worst case testing scenarios are extremely rare in a real setting. You could explore real case situations by means of a dynamic geometry simulation (see simulation link above).
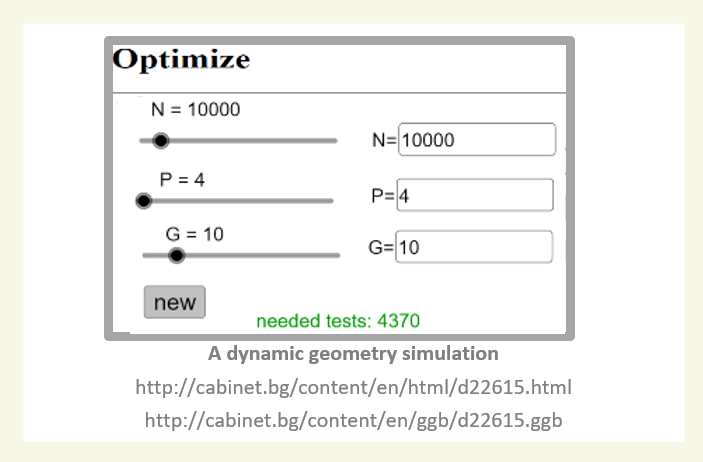
Let N be the number of inhabitans, P the percentage of the infected ones, and G the size of the groups of blood samples being mixed. The simulation checks which of the consecutive groups are infected and computes the necessary number of tests under the specific values of P, N and G and the specific „random“ arrangement of the infected ( ) blood samples.
If you run the simulation multiple times with the same values of N, P and G (the new button), you could find the average (mean) value for the number of the necessary tests.
What is the mean value of the necessary number of tests if:
- N = 10 000, P = 4% and G =10?
- N = 10 000, P = 4% and G =11?
- N = 10 000, P = 4% and G =9?
What should be the group size G so that the mean value of the necessary tests be minimal if N = 10 000 and P = 4%?
If you have 10 000 test kits and expect 4% of the population to be infected, what size G of the groups of blood samples would you choose so as to maximize the number of the people tested?
This Worksheet is part of the Quartely Problem Series. For more quartely problems and other classroom materials, click here.
Picture Source: Image by Yovko Kolarov
CC-BY-NC-SA 4.0 licence granted
Content-related competences