In some cities, bicycle counters have now been installed in busy locations. These record how many bicycles have passed this location on a given day. Firstly, this is intended to raise awareness of sustainable modes of transport and encourage people to use bicycles more. In Addition, the number of bicycles passing by is often recorded throughout the year, giving the city a reference point for the general development of transport culture over the course of the year and over the years.
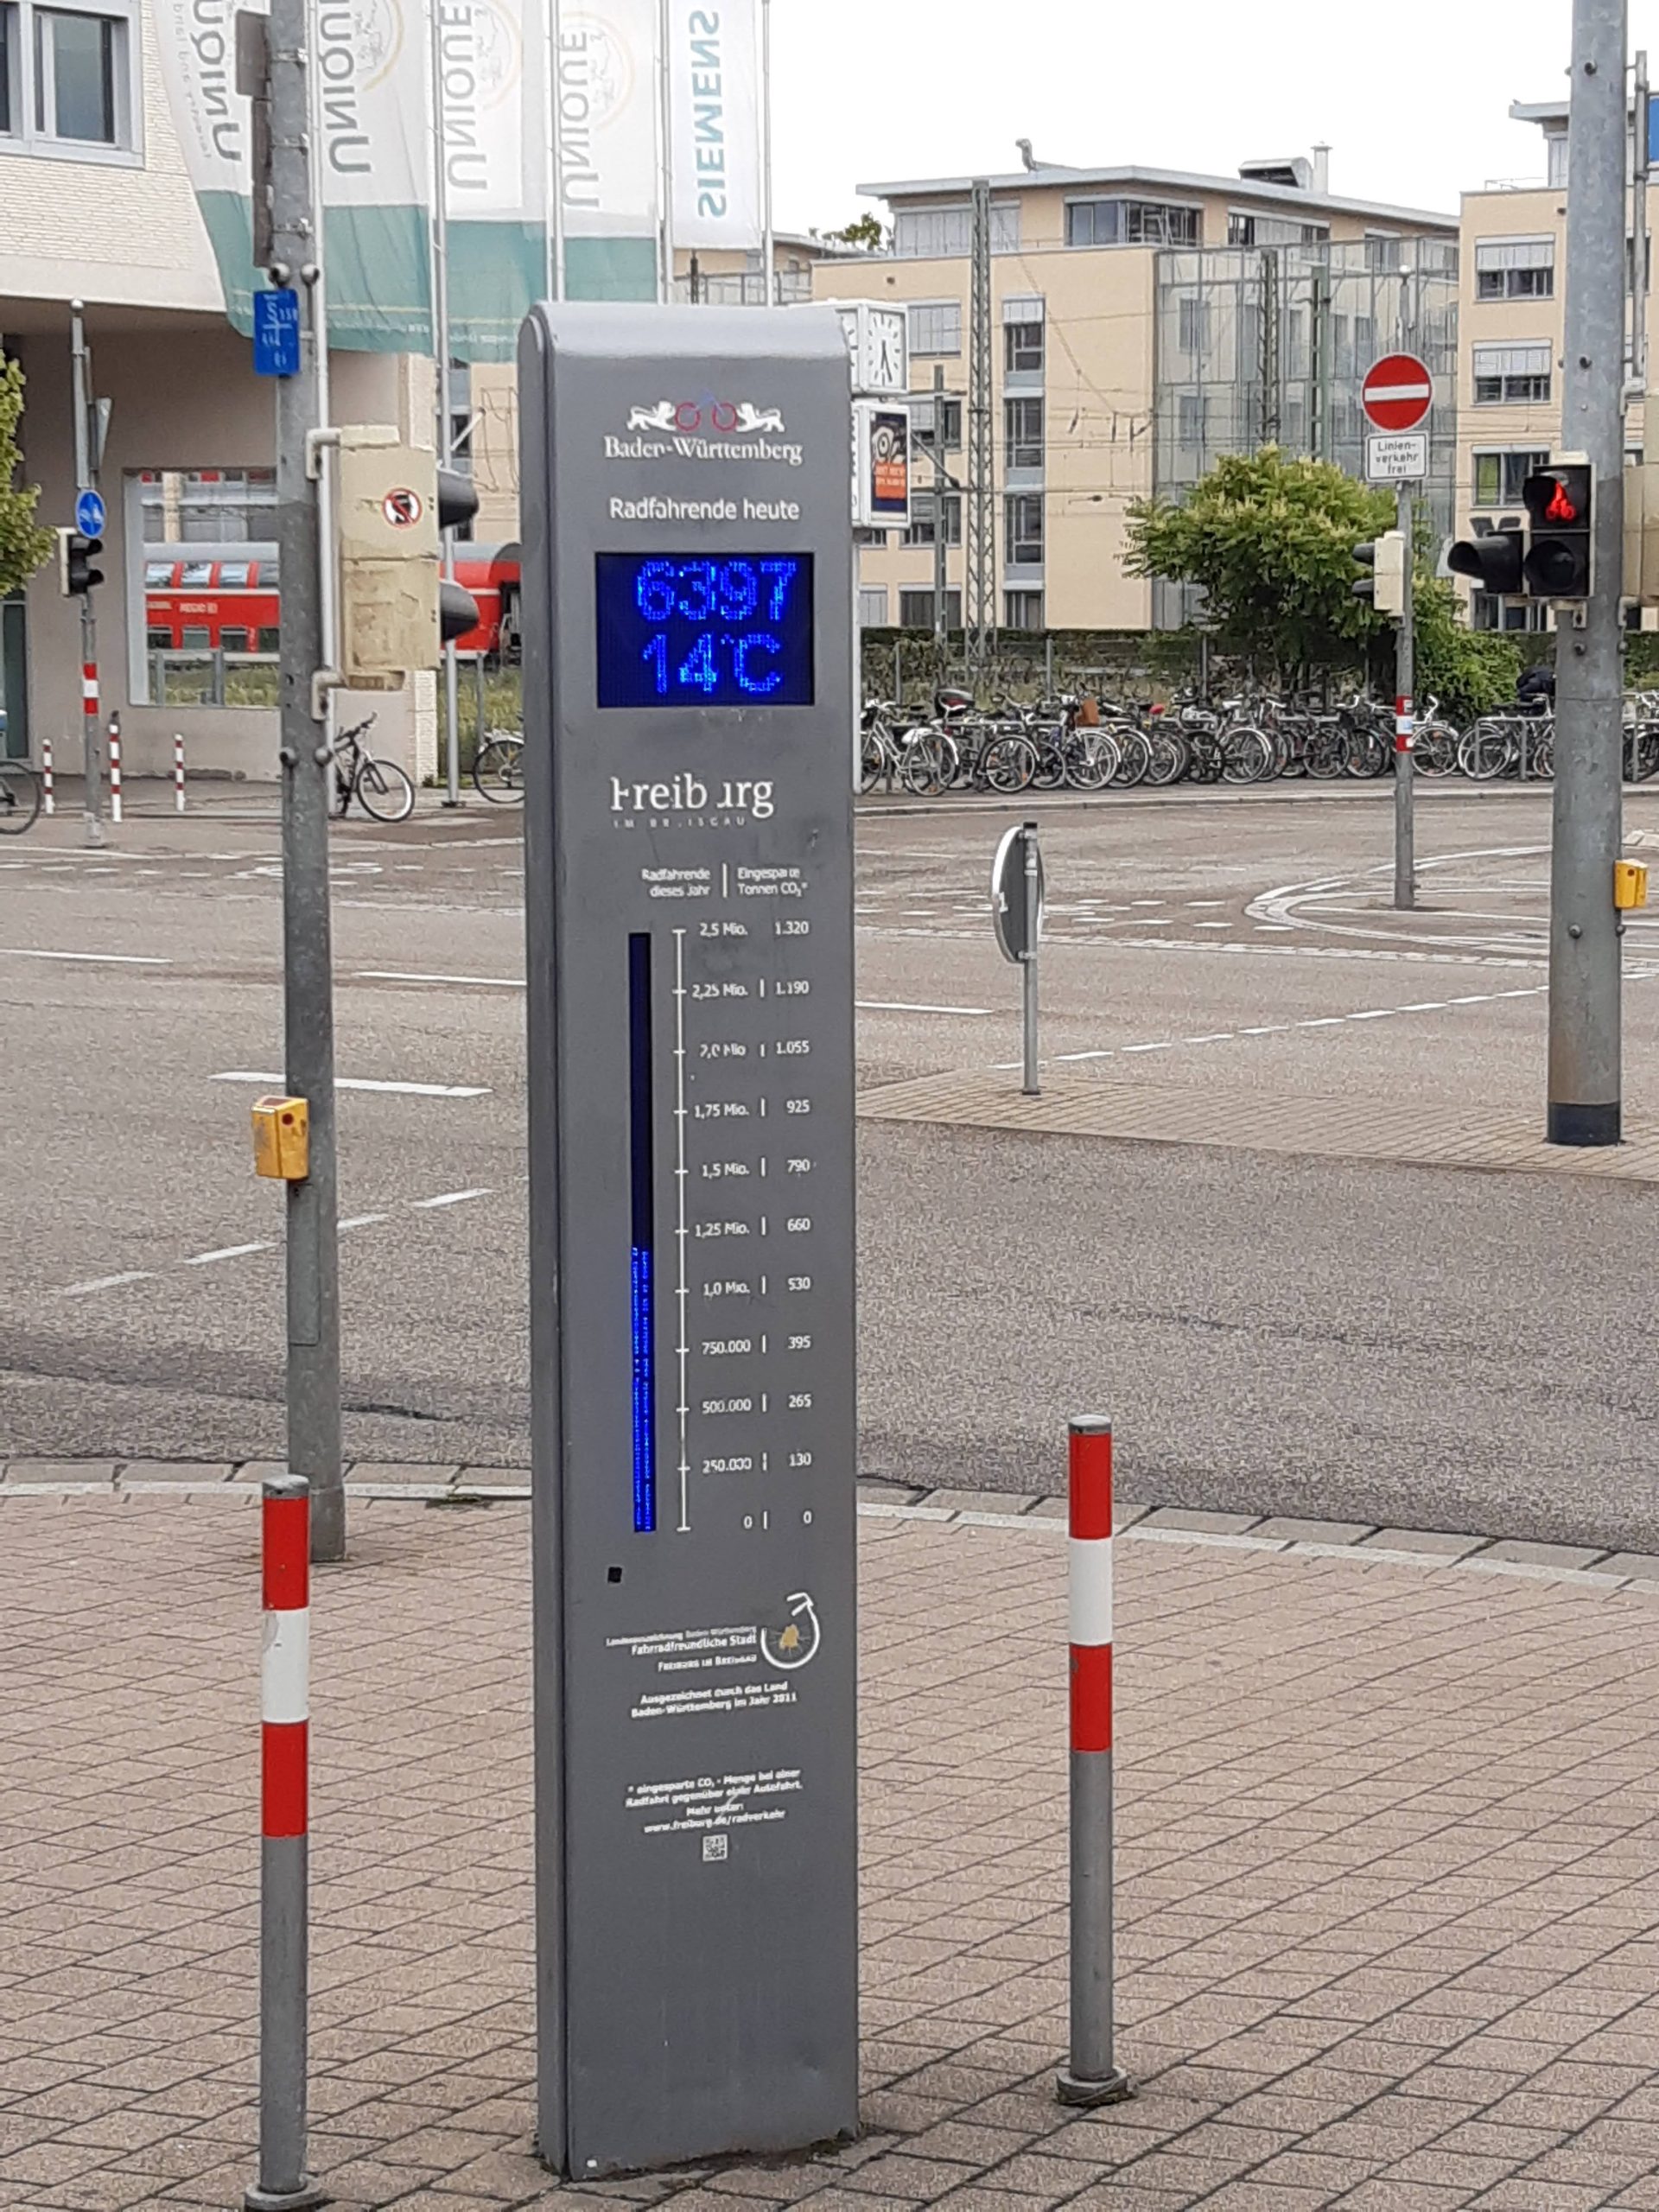
If you regularly pass a bicycle counter, you get a feel for how many bicycles pass by on a given day at that location. The following pictures show the bicycle counter in the city of Freiburg at the “Blue Bridge” (Wiwilibrücke) at the train station. The counter was photographed at different times of the day and different times of the year. Make educated guesses as to what time of day and season the respective photos were taken. What else, besides the time of day and season, could influence the number displayed?
Now create a table (or diagram) in which you note how the number of passing bicycles changes over the year and depending on the time of day. What other conclusions can the city draw from the bicycle count?
This Worksheet is part of the Quartely Problem Series. For more quartely problems and other classroom materials, click here.
Picture Source: ICSE, Katharina Flößer
CC-BY-NC-SA 4.0 licence granted
Content-related competences