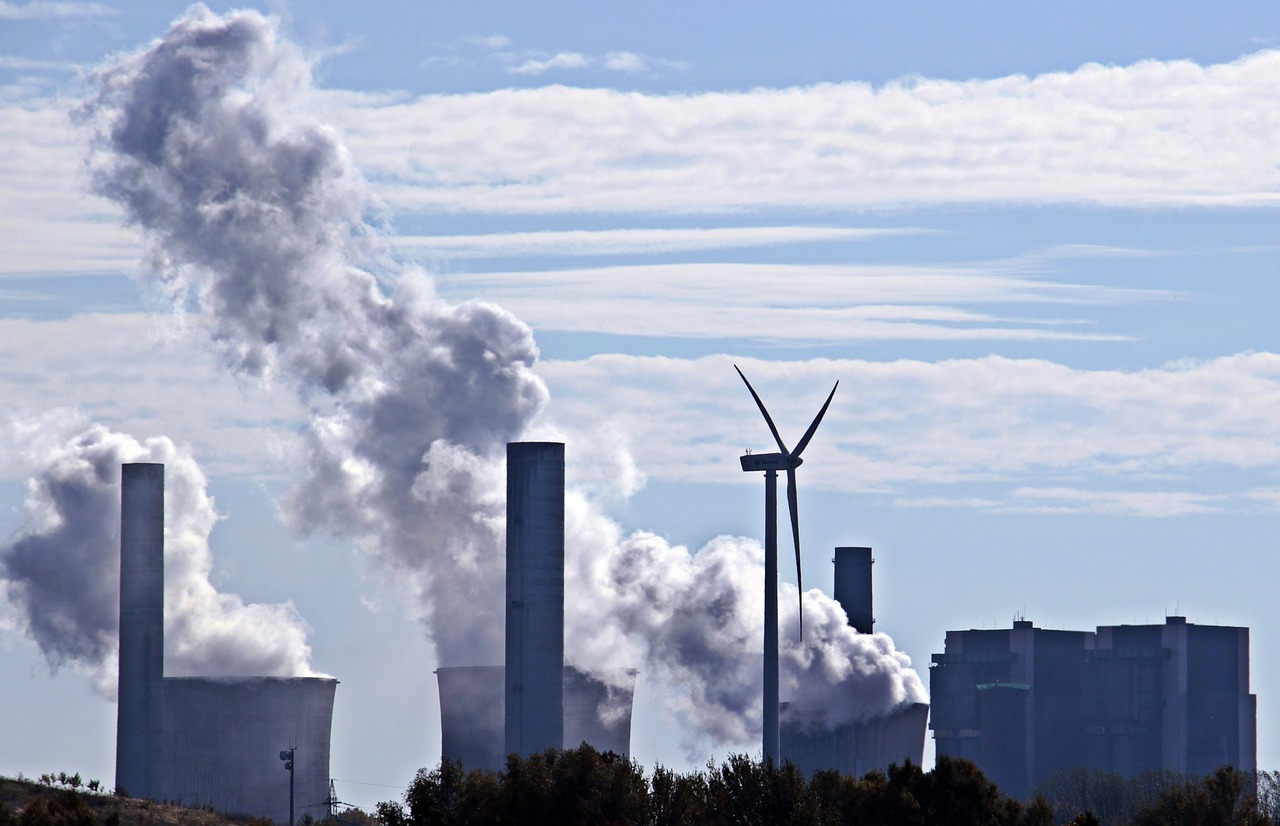
Greenhouse gases need to be cut at every turn, but neither at the political and societal level nor in one’s own habits you can change everything at the same time. So where do we start? Perhaps where it will do the most good? But where is that actually?
- Search the internet for numbers on greenhouse gas emissions of various products such as food, clothing, mobility, but also average total emissions per capita, etc.
- Think about which of these figures are particularly interesting for you. Relate the values that are most interesting to you in a way that helps you understand them. For example:
- “If I always eat margarine instead of butter, I will save as much greenhouse gases in a year as are emitted by a car trip of … km.”
- “If I use my old cell phone that much longer, it’s equivalent to … T-shirts in terms of emissions.”
- Present your findings to each other. Which comparisons do you find particularly illuminating/surprising?
Tip: You can find more on this topic in the book “How bad are bananas?”.
This Worksheet is part of the Quartely Problem Series. For more quartely problems and other classroom materials, click here.
Picture sources: NoName_13 on Pixabay
CC-BY-NC-SA 4.0 licence granted
Content-related competences
