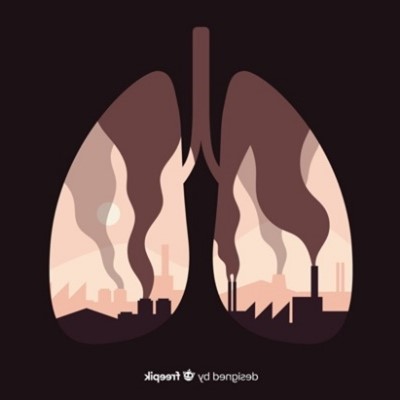
According to World Health Organization (WHO), more than seven million people die every year due to air pollution. Air pollutants arise from a wide variety of natural processes (e.g. forest fires, volcanoes, and bacteria) and human activities (use of motor vehicles and industry). A wide variety of pollutants, in particular carbon monoxide (CO), nitrogen dioxide (NO2), sulfur dioxide (SO2), particulates (PM10), ozone (O3) are monitored for air quality.
Let’s investigate air pollution, how it is monitored and its effects on human health. You can collect or analyze data for your city in terms of the levels of air pollution and investigate the effect of air pollution on human health.
- Use different Air Quality Monitoring sites to see air quality level in your location. What does the graph show? What factors could cause the small peaks and troughs in the graph within the day, week or month?
- Compare air pollutants’ levels with those found around the airports, motorways and industry zones. Are they lower or higher than at your home or school’s locations?
- What can be done to improve air quality?
- Investigate the effects of air pollutants on human health.
Here are some Air Quality Indexes:
- Real-time Air Quality Index : org
- World Health Organization: who.int/airpollution
- The Plume City Air Report Map: plumelabs.com/en
- European Air Quality Index: eea.europa.eu
Picture Source: https://de.freepik.com/fotos-vektoren-kostenlos/stadt
Subject
Biology, Chemistry, Classroom Materials, General Science, Interdisciplinary teaching, Mathematics
Year
2022
Topics
Inquiry-based learning, Reallife Problems, Interdisciplinary Topics
Guiding ideas /
Content-related competences
Content-related competences
Measuring, Data and probability
Grades
Author
Gultekin Cakmakci & Oliver Straser